PUMAdb : Help : GO::TermFinder
Your session is inactive. Login
Contents
GO::TermFinder can be accessed after clustering a dataset, such that you are able to determine whether the genes in a certain subcluster have any significantly enriched GO terms. Following clustering, you will have a web page such as shown in Figure 1.
Figure 1: Clustering Results Page. To navigate and explore your cluster using GO::TermFinder, click on the image of the cluster.
By clicking on the cluster image itself, you will launch the Cluster View display, which allows you to navigate and search your cluster. An example of the Cluster View is provided in Figure 2.:
Figure 2: Hierarchical Cluster View. In order to analyze and view GO terms for a subcluster, click on a green box associated with a node (one of which is indicated with an arrow).

In the Hierarchical Cluster View, the green colored rectangles can be used to submit the list of genes within that node to GO::TermFinder. In this case, clicking on the green box for the top level node will produce a page like that shown in Figure 3:
Figure 3: Term Finder submission.
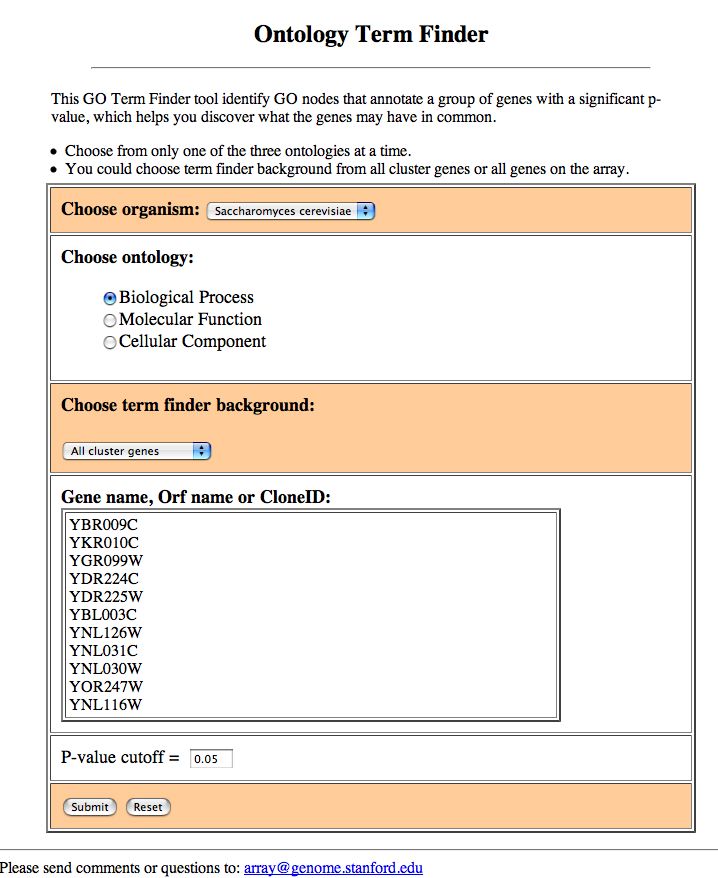
In this page you should choose the ontology that you wish to query for overrepresented terms, the background distribution set of genes for the calculation (either all genes that were in your original cluster, of which your subcluster was a part, or all genes that were on your array), and a p-value cutoff. Figure 4 shows an example of such a result:
Figure 4: GO::TermFinder Result. An example of the results from GO::TermFinder, showing GO::Nodes in order of decreasing significance.

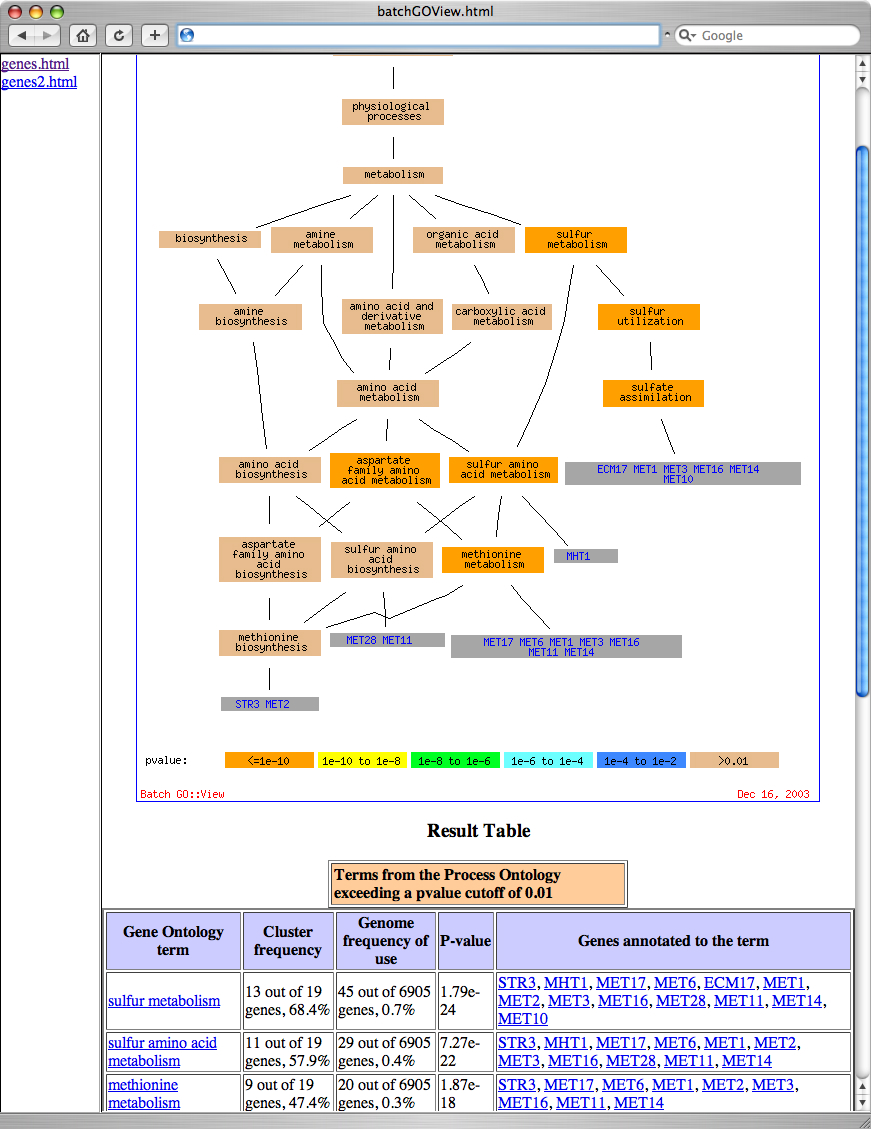
In this case, NUM_ANNOTATIONS/TOTAL_NUM_ANNOTATIONS indicates how many genes in your set of interesting genes are annotated to a GO node, compared to how many are annotated to that node in the background population. Clicking on the 'Display term finder map' link will show a display of the ontology terms and their relationships, and the color of the nodes indicates their significance. Figure 5 shows a graphic representation of the data from Figure 4:
Figure 5: Graphical View of GO::TermFinder Result


Typically, a cut-off for p-values, known as the alpha level, is chosen, such that p-values below the alpha level are deemed significant. The alpha level is the chance taken by researchers to make a type one error. When a type one error is made, an effect, difference or relationship that is actually due to random chance is incorrectly declared to be significant. This is also known as a False Positive. Customarily the alpha level is set at 0.05, or, in no more than one in twenty statistical tests the test will show 'something' while in fact there is nothing. In the case of more than one statistical test, there is an increasing chance of falsely identifying a test to be statistically significant due to chance fluctuation, and incorrectly declaring a difference or relationship to be true, increases. In five tests the chance of finding at least one difference or relationship significant due to chance fluctuation equals 0.22, or one in five. In ten tests this chance increases to 0.40, which is about one in two. Thus we need to make an adjustment that will correct for multiple hypotheses. This is known as multiple hypothesis correction. The Bonferroni method adjusts the alpha level of each individual test downwards to ensure that the overall risk for a number of tests remains 0.05. Even if more than one test is done the risk of finding a difference or effect incorrectly significant continues to be 0.05. To do this, it simply divides the alpha-level by the number of hypotheses that were tested. If 20 hypotheses were tested, then instead of using an alpha-level of 0.05, an alpha level of 0.0025 would be used. Alternatively, the p-values can be adjusted, by multiplying by the number of hypotheses that were tested, and the alpha-level can be kept the same. This approach is the one that GO::TermFinder takes. In the case of GO::TermFinder, the value used for the Bonferroni correction is the number of nodes to which the genes of interest are collectively annotated, excluding those nodes which only have a single annotation in the background distribution, which a priori cannot be significantly enriched. The Bonferroni correction assumes, however, that all hypotheses are independent. In the case of the GO::TermFinder, each hypothesis is a node in the Gene Ontology, which has two or more annotations (either directly or indirectly) from the tested group of genes (nodes with only one annotation are not tested). Because these hypotheses form a Directed Acyclic Graph (which is a subgraph of the full GO DAG), there are relationships between the hypotheses, and they are therefore not independent, and thus the Bonferroni correction may not be appropriate. Simulations have shown that the Bonferroni correction in GO::TermFinder is typically too liberal, by a factor of between 2 and 3 fold. The 'CORRECTED P-VALUE' provided on the GO::TermFinder Result page are Bonferroni corrected. Thus a GO term with a corrected p-value of 0.01 or less can be confidently selected.
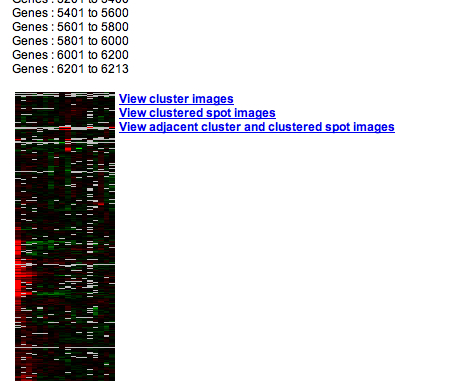
GO::TermFinder is available as a stand-alone tool that can be run on the command line in both single and batch modes, and can produce a browsable interface for examining the results of processing many lists of genes with GO::TermFinder. GO::TermFinder can be downloaded from the Comprehensive Perl Archive Network (CPAN) here. To install it, you will require a system capable of running Perl. Comprehensive installation and use instructions are contained within the CPAN distribution. Figure 6 shows an example of the batch browsing interface.
Figure 6: Batch interface generated by locally installed GO::TermFinder. Each list of genes provided to the batch processor results in a link in the left hand frame. Clicking on the name of a list shows the GO::TermFinder result in the right hand frame.