Contents
The
Data Entry for
Microarray Experiment form is used to enter experiments into the
database one at a time. This help describes how to fill out the form
to enter an experiment. Experiments can also be entered by batch, and
a separate
batch help is
available for that procedure.
It is assumed you've already read First Time Users and What You Need from the
previous help file, Entering Results
from Experiments

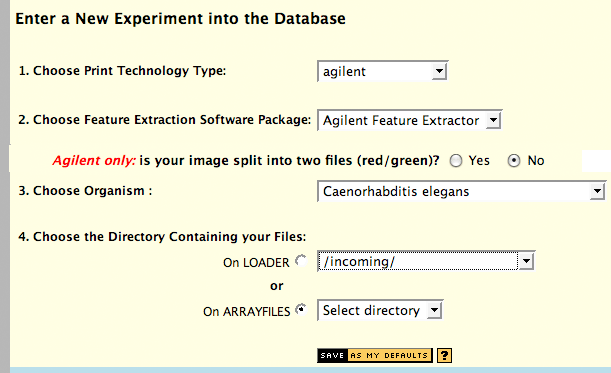
The first step in entering an experiment is to specify the print
technology type, software package, organism, and directory which
contains your files. Files can reside in either your incoming
directory on loader, a subdirectory thereof, or in your arrayfiles
directory (or subdirectory thereof) on the Microarray Facility's
server, if you have an account there. All files for an experiment
should reside in the same directory.
Agilent multi-channel
image support : this is where you indicate if you have split the
image through the TiffSplitter program, or are uploading a single,
multi-page TIFF file.
A "Result Set" is one version of data for a given
hybridization. Both Agilent and Affymetrix/dChip software allow you
to set various parameters which can affect the set of extracted
results. For example, Agilent Feature Extractor has several different
normalization schemes which would produce a distinct result set for
the same array image. For Affymetrix, the cell file is considered a
distinct result set from the results of the probe set derivation (you
should have exactly one cell file result set, and one or more data
file result sets, per Affymetrix array). Generally speaking, only
power-users that are exploring different feature extraction parameters
or normalization schemes would be producing multiple result sets from a
single array. For example, a researcher may scan a slide once
(defining a "slide" and "experiment" for the purposes of the
database), but choose several different ways to normalize or compute
the extracted data, producing multiple result sets for the single
array. However, this example is very seldom seen.
- Enter the name for the result set and a description specific to
the set; e.g., details of your chosen normalization scheme, or the
software used (say, MAS 5 vs. GCOS vs. dChip vs. SNPSncanner).
Information describing the experiment or encompassing all result sets
(e.g., for Affymetrix, the cell data and every Probe Set intensity
set) is entered in the Experiment Description and Details section.

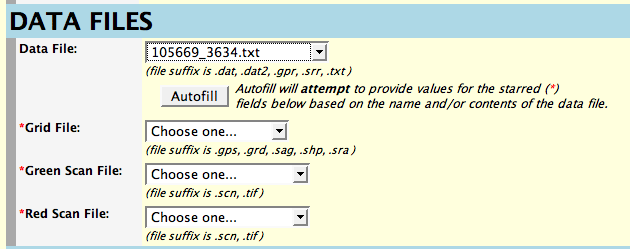
The file location pulldown menus will contain a list of your files in
the directory you specified on the previous page. The data file is
first and after you select it you press the button labeled "Autofill".
Autofill will attempt to select the names of the other three files
based on the name of the data file. If it cannot do so, you will need
to specify each of the three remaining files. Note that we now accept
compressed (.gz) files, but make sure that they are transferred to
loader as binary or "raw" data. (Files with the
extensions .gps, .sag, .sra, .tif as well as Affymetrix .DAT files
should also be transferred in binary. All others should be
transferred as ASCII text. For more information
about transferring files, refer to
the Entering Results from
Experiments document.
Experiment Description And Details Section

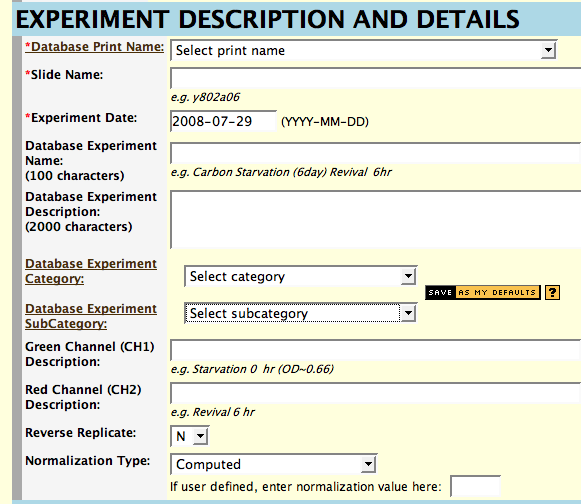
- Determine the print your experiment uses and select it from the
pop-up list. Clicking on
Print Name will get you information about these prints. If you are
unsure about which print to use, contact the microarray database
curators. If you are entering data for an Agilent experiment and have selected
the data file, the Autofill option will attempt to determine the print by mapping
the barcode in the file to the database.
- Enter a unique name for the slide used in this experiment in the
Slide Name box. A systematic slide name, usually dictated by the array
producer, is preferred (unique).
If you are entering data for an Agilent experiment and have selected
the data file, the Autofill option will attempt to construct the slide name by looking
up the barcode in the file.
Note: All text entry on the forms is case
sensitive. Also, please avoid the use of single and double quotes
('a' and "a") in your entries.
- Enter a date you want associated with the experiment; the date of
hybridization is recommended. The date format is 4-digit year, 2-digit month, and 2-digit day (YYYY-MM-DD).
This too is looked up for Agilent if you press Autofill.
- For Experiment Name, enter a unique, descriptive name for your
experiment. The maximum length is 100 characters.
- You have space to enter 2000 characters of text description for the
experiment. This is optional and is intended for useful notes, such as a
description of the methods used in sample preparation. There are
separate description fields below to specifically identify the red and green channels.
- Choose an experiment category and subcategory. If you need
more information about categories
or subcategories,
click on the links to the left of the pop-up menus. If you need new
categories or subcategories created, contact the microarray database curators.
Note that you can save these values as your preference for the form, so they will be selected
the next time you use it.
- Enter short descriptions of the samples used for the green and red channels in this experiment. The maximum length is 100 characters, and descriptions are usually phrases such as "reference pool", or "nitrogen starvation, 2 days".
- If you wish to define your own normalization, check 'User
Defined' and enter a normalization value in the box provided. Otherwise,
accept the default-computed
normalization ('Computed' on the form) or select 'Using regression
correlation' if you wish to use this method. Normalization type is
required for entering Agilent or Affymetrix data, but is ignored.
Array Access Section
- Enter the login name of the person who
performed the experiment in the Experimenter box. This will be
the only person, save the curators, with the ability to edit or delete
the array. By default, your entire lab group will automatically have view access to your experiment.
- Choose who will be able to see the data from your array using the
multiple-select scrolling lists under Collaborative Group. You may
select one or more Collaborative Groups and/or one or more individual
users who will be able to view your data. (To select multiple choices
in a list, hold down the command/apple key on MacOS or the control key
on a Windows while you click. With Unix, just click on multiple
names.) Lists of collaborative
groups and individual users
can be obtained by clicking the links to the left of the scrolling
menus or by clicking "User group" or "Users" under "List Data" on the
main page.
- Click the "Load Experiment into Database" button to enter your
experiment.
Monitoring Your Request as it Progresses Within the Queue
Experiment loading is commenced by entering your loading-data into a
queue. The rate of loading is determined by a number of factors,
including both the load on the database and how many other array-load
requests were made prior to yours. If there are no delays, it usually
takes at least five minutes per array, but can take
quite a bit longer if your arrays have a large number of spots (human arrays) or
if many other users are using the database. An Affymetrix tiling array can
take up to one hour to load into the database and so as not to slow the
database to a crawl, only one tiling array can be run at once; all other jobs are queued.
During this time, you can check the progress of your experiment load
within the queue. After your data is successfully entered into the
queue (note: this is not the same thing as final entry into the
database), you should receive a confirmation screen as well as an
email notifying you:
	Your database entry request (batch number XXXX) has been
queued for loading.

	Please note the data for your array(s) ARE NOT YET IN THE
DATABASE.  Do NOT delete any of your files until you receive email
confirmation that the data have been loaded.

	Progress of is batch within the queue can be viewed at:

http://puma.princeton.edu/cgi-bin/tools/queue/nph-ProgressQuery?batchno=XXXX

	If you have any questions please contact the database curators

	array@princeton.edu)
You can check the progress
of your experiment load based on the batch number reported to you
with either the link on the queue confirmation page or from the URL in
the email.
Successful Result Entry into the Database
If all goes well, you will eventually get an email
message that says:
    Loading of your array data (batch number XXXX) has completed.

  1 out of 1 were successfully loaded.

    Details of the load process have been written to:

    /loader/ftphome/username/logs/XXXX.log,

    or you can temporarily view the details via the web at:

    http://puma.princeton.edu/cgi-bin/tools/queue/nph-ProgressQuery?batchno=XXXX

    If you have any questions please contact the curators

    (array@princeton.edu).
At the bottom of the HTML confirmation page or in the log file in your logs directory on loader.princeton.edu should be the message:
==== 1 out of 1 were successfully loaded. ====
In the case of a batch load the numbers would be greater, for example, "10 out of 10".
Common Problems
- If your results have not been loaded 1 day after entry into the
queue, please notify the microarray database curators.
- File location: All files must be in the same directory or subdirectory of your incoming account on loader.princeton.edu or the arrayfiles server.
- UNIX file names: The names of your uploaded files
should not
contain spaces, or any of
the following characters:
'
"
#
,
/
\
?
<
>
;
:
!
@
%
^
&
*
(
)
- Occasionally, we backup and re-index the database. This process
can significantly delay the loading of data (and vice versa). We
suggest not loading during these time periods. Consult the Scheduled
Database Backups page for the times to avoid.
- Sometimes the conversion of the 2 TIFF images to a proxy image
(for web viewing) fails. Please check your loaded arrays by
displaying them and verifying the clickable-image. If you need to
replace the gif file that we have created for you, please see our help documentation for this.
If there is no clickable-image icon present, contact the microarray database
curators.
- Errors? What errors? Shortly after a queue batch
request is processed (successfully or not), you will no longer be able
to monitor its status within the queue (as it has been removed, and its
web log with it). However, just check your logs directory on
loader.princeton.edu to see the text log file of the database entry.
The log file name uses the batch number, e.g. "1234.log".


