PUMAdb : Help : Q-Score Help
Your session is inactive. Login
Contents
Related Help Documents
- Result set lists: Information on organizing arrays and specifying filters on a per-array basis.
- Genelists: Create and use genelists
The q-score is a quality measure for an array based on a subset (see later) of the spots present on the array. It is calculated for a spot-quality filter and can be used to guide selection of a cut-off value for that filter to remove low quality spots.
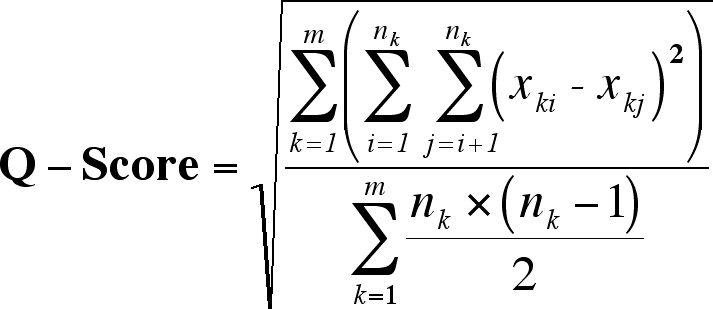
It is very common that the expression of a gene is measured multiple times, using different sequence probes on the same array. For example, several different cDNA clones that map to the same Unigene cluster can be present on one array. These clones typically are distributed randomly across the array. Although two such clones may not give the exact same intensity measurement for the same sample, the log-ratios can be treated as parallel measurements for clones that are 'well behaved'. The average spread of the log-ratios of clones within clusterids may be used to assess the quality of an array. The greater the spread of the log-ratios indicates a lower quality array while a better quality array should have a tighter spread of values. The q-score is a measure of the 'within clusterid' spread of the data and can be calculated using the formula on Figure 1.

|
| Figure 1: Q-score formula. nk: number of clones in a clusterid; m: number of clusterids with more than 1 clones; x: log-ratio measurement for feature i of clusterid k minus the mean log-ratio for clusterid k. |
A lower value of this score means a narrower spread of the data and a better quality array, while a higher value a wider spread of the data and lower quality array.
In addition to its potential use for array quality assessment in array-to-array comparisons, the score can be used for eliminating lower quality spots for a single array. It can be expected that by increasing the stringency of a suitable filter spots with lower quality will be eliminated resulting in a better q-score for the remaining clones that were not filtered out.
To calculate q-scores the program will need the following inputs:
Result sets: The arrays for which q-scores are calculated have to be in a result set list in your loader/arraylists/ directory. Currently, only Genepix (or Scanalyze/SpotReader) arrays can be used.
Genelists: You can use your own list of genes (cloneids) to calculate the q-score. The genelist is expected to be in your loader/genelists/ directory. In addition, there are common genelists available for all users. These common genelists are displayed together with the content of your genelists directory and have a 'COMMONLISTS:' tag pre-pending their names. Among these common genelists are geneslists with the extention '_all'. These genelists list all cloneids in the database that are mapped to clusterids with more than one cloneid annotated to them . The second type of common genelists have the extention '_corr_MMDDYY' and are generated as a result of further processing of the first set of common genelists. These latter files contain a subset of the complete genelists: the cloneids that don't correlate well to the other cloneids belonging to the same clusterid, across all published data in the database, are removed. Currently, only mouse and human arrays can be analyzed, because clusterids are available for only these two organisms in the database.
Filters: Select the filter you would like to use to eliminate lower quality spots from the array. The program will calculate q-scores for the range between 'Filter min value' to 'Filter max value' by dividing the range into 500 equal steps by default. At each subsequent filter value the spots whose value for the given filter is smaller than the current filter value are eliminated and the q-score is calculated for the remaining clones using the selected log-ratio data.
A comparison of different filters on a small dataset gave the best results using the correlation and 'error' filters. This analysis was based on several criteria of the q-score vs fractions graph: the area under the (the smaller the better); the initial slope of the curve (the steeper the better); the smoothness of the curve (the smoother the better).
Ranges: minimal and maximal values for the selected filters. The accepted values are either numerical values or 'min'/'max'. In the latter case the program will find the minimal and maximal values for the filter for the arrays in the arraylist and use that as the range. 'Filter min value' is expected to be the least stringent value for the filter; 'Filter max value', the most. For filters that become more stringent with increasing numerical value (e.g. regression correlation) 'Filter min value' can be a smaller number or 'min' and 'Filter max value' a larger number or 'max'. For filters that are more stringent at lower numerical values (e.g. regression ratio) 'Filter min value' can be a larger number or 'max' and 'Filter max value' a smaller number or 'min'.
Log-ratio values: The values from this column are used to calculate q-score.
Running program in background: Whether you would like the program to run in the background. It is recommended that you use this feature. When the calculation is over you will receive an email with a link to your results.
After starting q-score calculation, the program first retrieves all data from the database, putting all data in one pcl file for each filter and log-ratio column selected. During this step very minimal data filtering is done: flagged, contaminated, failed, empty and control spots are removed. After data retrieval q-scores are calculated for each filter and array at each filter value.
The program will produce the following five files for each filter selected:
The files can be either directly navigated to in the browser or a link is emailed to you if the process was run in the background.
Result file: This is a tab-delimited text file (.res):
The fractions are calculated relative to the initial number of cloneids for which data could be retrieved from the database.
Q vs Filter: displays the q-scores as a function of filter values (less to more stringent).
Fraction vs Filter: displays the fraction of clones not filtered out as a function of filter values (less to more stringent)
Q vs Fraction: displays q-scores as a function of the fraction of clones not filtered out.
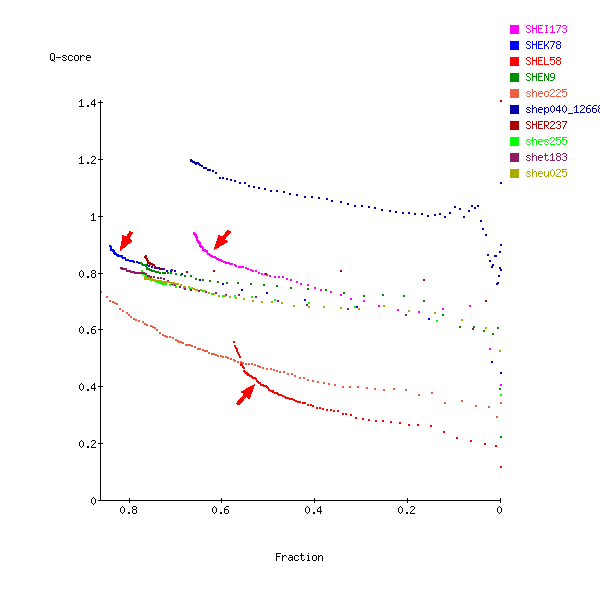
The expectation is that the q-score will decrease more or less monotonously with increasingly stringent filter values. Using a filter that is removing lower quality spots you might expect the score to drop faster initially, then reach a region of plateau or slower rate of decrease. You might want to pick a filter value at this inflection point. The graph with the remaining fraction of the clones gives you an idea about what fraction of the clones are lost at the chosen filter value. An example is shown on the Q vs Fraction graph below (Figure 2.). The arrows show clear inflection points for the arrays indicated. The corresponding filter values can be determined from the Fraction vs Filter or the Q vs Filter graphs.

Figure 2: Example Q vs Fraction graph showing inflection points (red arrows) for several arrays.